Back at the start of the 2014 Major League Baseball season, new rules were implemented for making plays reviewable. Managers are now allowed to have certain plays reviewed and potentially overturned. There’s only 1 full season and a couple months of data, but let’s dig in and see what we can learn.
I’m interested in finding out several things: Which teams ask for reviews the most? Which teams are the most successful? Are there any umpires who find their calls being reviewed and overturned more than others? Also, how long do reviews take, and does the length of the review time hint at the ruling for the review?
Data Summary and Meanings
I got the data on MLB challenges from Retrosheet.org. It’s an excellent site for baseball data, and they only ask for users of the data to post the following notice:
The information used here was obtained free of charge from and is copyrighted by Retrosheet.
Interested parties may contact Retrosheet at 20 Sunset Rd., Newark, DE 19711.
That’s easy enough! Thanks for the free data, Retrosheet folks.
The data are from 03/31/2014 to 04/25/2015, and the end date was chosen because that’s the last date that the data had no missing data. There are 1411 data points. The columns in the data are:
Date, Challenging Team, Opposing Team, Inning, Initiator of the challenge, Umpire, Play type, Ruling, and Time of review
There are also some flags for indicating if MLB decided that a review was wrong, but that only happened 3 times. The other flags are just properties of the calls that don’t affect our analysis (calls that end in ejection: 25 of those, and calls that end the game: 18 of those).
A quick word on the rulings. Rulings can be ‘overturned’ (clear and convincing evidence that the call on the field was incorrect), ‘stands’ (no clear and convincing evidence to confirm or overturn the call), or ‘confirmed’ (clear and convincing evidence that the call on the field was correct). Overturned calls give the teams back their challenge, while the other two use that challenge up. I consider ‘Overturned’ to be good for the challenging team, and the other two are lumped into a ‘bad for the challenging team’ category in many cases.
As usual, any errors are probably my own. Let me know if you spot something wrong, and I’ll do my best to correct it!
Initial Data Summary
Here’s a breakdown of the ruling results:
| Ruling | % Occurrence |
|---|---|
| Overturned | 46.78 % |
| Stands | 28.70 % |
| Confirmed | 23.88 % |
| Rcd keeping | 0.64 % |
For the challenge initiators (managers or umpires), here’s the breakdown:
| Initiator | % Occurrence |
|---|---|
| Mgr | 83.20 % |
| Ump | 16.80 % |
When looking at the rulings for manager vs umpire initiated calls, the managers are making challenges to try to get overturned (duh), but the umpires are making challenges that tend to get confirmed:
| Manager | Umpire | |
|---|---|---|
| Confirmed | 17.12 % | 57.38 % |
| Overturned | 52.04 % | 20.68 % |
| Rcd keeping | nan | 3.80 % |
| Stands | 30.83 % | 8.14 % |
The top plays being challenged by managers are: Force Plays (49%) and Tag Plays (40%). For umpires, the plays are: Home Run Reviews (42%) and Home Plate Collisions (40%).
Team Challenge Successes
Challenges are successful when they result in an overturned call. Their real value, though, is in what they buy the challenging team. My ideal metric for challenge success would be something like a Win Probability Added based on the outcome of the challenge, but I don’t have a WPA model for the MLB! If someone has this data, I would really like to play with it, if possible.
Absent that more realistic metric of challenge success, we’ll just use the percent of successful challenges. The following chart shows the number of challenges by a team, along with with their success ratio:

Notice that more successful teams seem to challenge less often. BOS and MIN are on top of one another, as are LAD and ANA. To rank the teams in terms of challenge success, we need to account for the amount of challenges as well as their success rate. Here is a plot of the estimate success rates, along with a 95% interval (the Jeffreys Credible Interval) on that estimate. I’ve sorted it by lower bounds so we are ranking teams by their ‘worst case’ success rate.

Click to open larger version
The Yankees and the Marlins must have some good staff in the booth to pick the right challenges. On the other hand, this kind of data is probably full of selection biases based on each team’s strategy. Toronto, the Cubs, and Tampa Bay appear to have a “hey, let’s just try it out and see what happens” mentality.
Team vs Team Challenges
We can use the data to build a set of team vs. team challenge success rates as well. This will tell us which teams challenge each other the most, and also which ones are the best at it. Since there are so many matchups, it’s hard to visualize the relationships between team. We’ll try in two ways.
First, I made a graph of all the teams, where the directed edges between two teams represent the number of challenge calls that went in favor of those teams. In other words, a big arrow going from Team A to Team B means that Team A had a lot of challenge calls go their way (and those calls were made by either A or B). Also, the size of a team’s node reflects the total number of challenges that they are involved in. Here’s the graph:
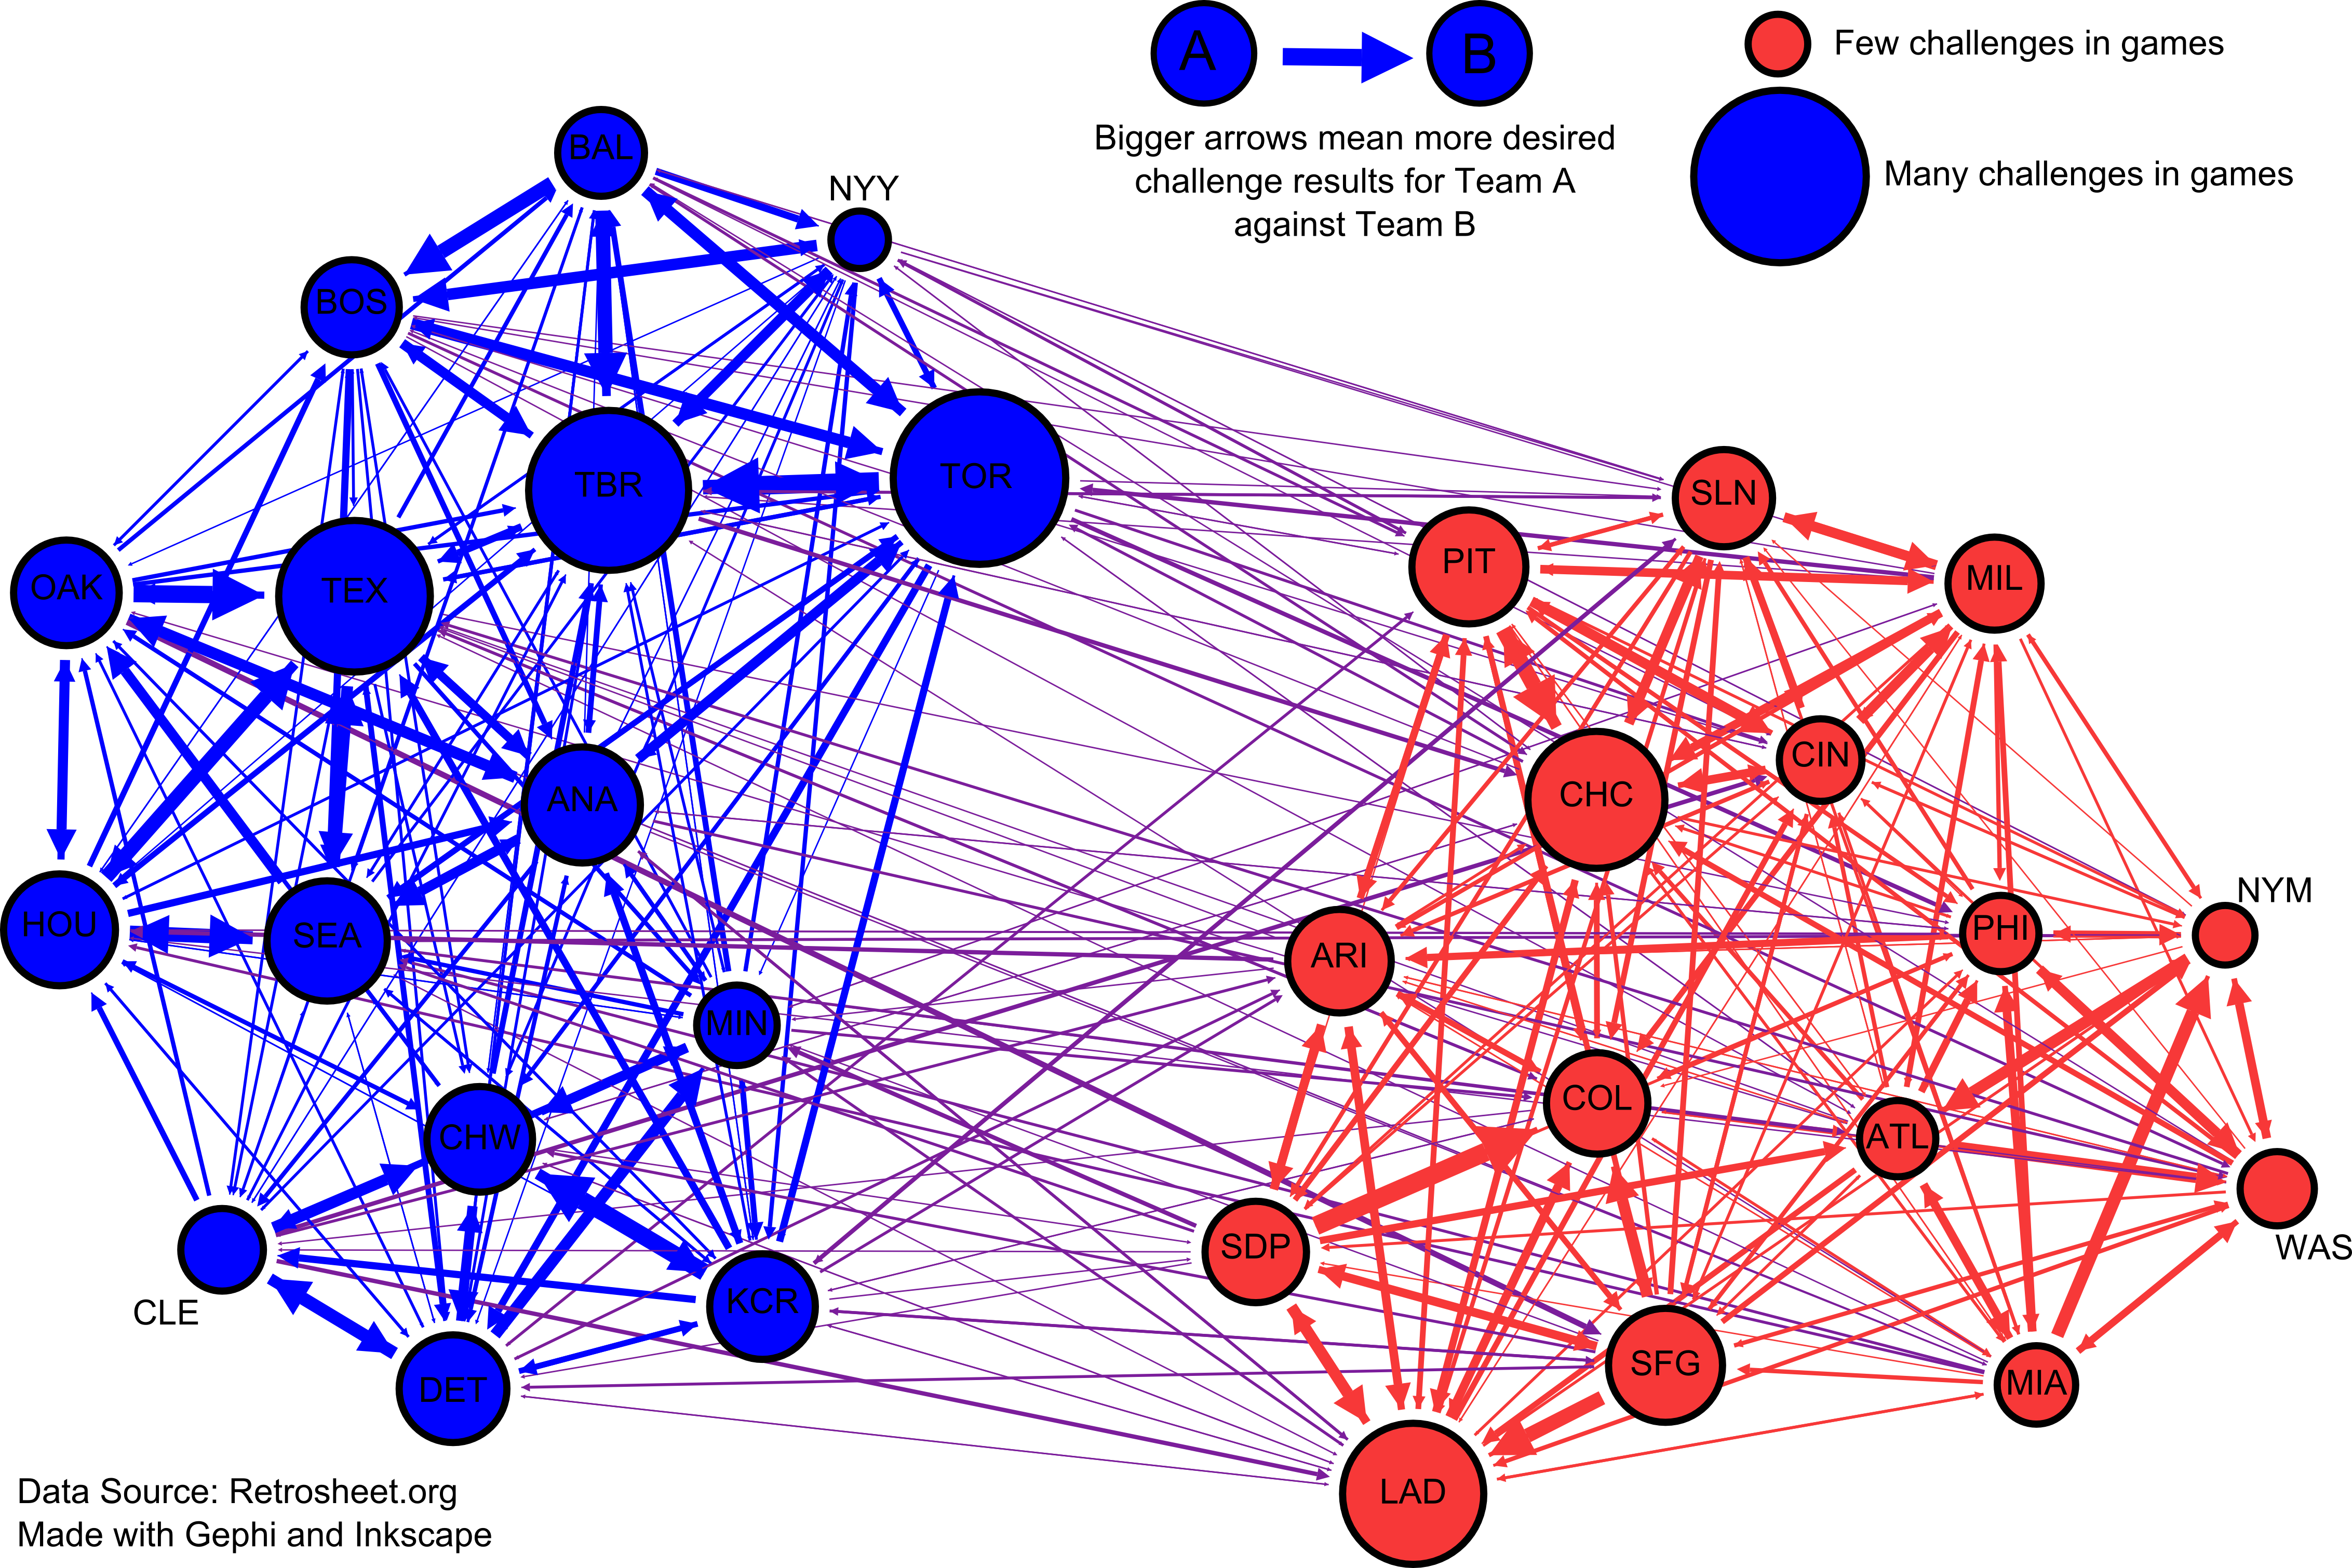
Click to open the vary large version in a new window
The graph gives us an idea of the ‘challenging’ relationships between teams. TOR and TBR really love to challenge each other! The larger arrow from TOR to TBR indicates that, of all the challenges that occured between the two teams, TOR had more favorable outcomes. That includes TOR getting an overturned or TBR failing to overturn.
We can view this data interactively, so you can dig into some of the specifics. The following plot shows the matchup success rates for teams, where the dot size indicates the number of challenges in that particular matchup. WordPress.com doesn’t allow javascript, so please click the plot to be taken to my github pages to view the interactive plot (apologies for that).

Click the image to go to an interactive version on GitHub
Umpire Accuracy
This section is what motivated the whole exercise to begin with. The other night on the Braves’ Fox Sports South broadcast (with Chip and Joe), one of them asked aloud about whether or not anyone was keeping track of the umpires that had their calls overturned or not. Here we are!
DISCLAIMER: I don’t want this data to make anyone think “wow, umpires are terrible” and start sending hate mail or anything. It’s important to keep in mind that being an umpire is not an easy job, plays move fast, and people make mistakes. There’s no way from this data to tell if a call is overturned because of pixel-level separation of a player’s sliding hand and the base! Umpires positioning also matters a great deal, and there’s no way to determine the “easiness” or “difficulty” of a call.
There’s so much selection bias here that I was almost hesitant to post the results. I decided to post them anyway, but remove the umpire names from the plot. If I made a mistake in interpreting the data (or something else), I don’t want an image floating around with someone’s name on with incorrect data!
I did the same analysis here that i did for the team success rate 95% interval. Here we are looking at the percentage of calls that the umpire did not have overturned.

Click to open the full-size version
There’s an wide range of umpire correctness, and I’ll leave thinking on why that is to the reader.
Review Timing and Results
The last thing we’ll look at is how long reviews take, and whether or not that has any relationship on the outcome of the review. First up, we have the distributions of review times given the eventual ruling of the review.

Overturned and Confirmed rulings are fairly quick, while ‘Stands’ rulings take longer. That’s because a ruling of ‘Stands’ is the one that says “we don’t have enough evidence either way”, so it’s probably going to take longer (and more video) to get to that ruling.
Finally, if you’re a betting person who’s timing the reviews, when should you expect one kind of ruling vs another? The following plots, made with a moving average procedure, shows the probabilities of a ruling, given the amount of time elapsed.


If the review is taking more than 1.5 minutes, you’re more likely to have the call not overturned.
Wrap Up
Thanks for reading, and feel free to ask any questions about the data or analysis in the comments!
Updates:
I updated the credible interval plots with better titles, and with a bug fix in the interval code I had. I used the Jeffreys Interval, because it’s more fun to be Bayesian. I also like it because it gives wide bounds for low data counts, among other properties.

[…] a fascinating and comprehensive stat-based piece, Primed delves into the numbers to look at how replay reviews are occurring and how they tend to be turning […]
LikeLike
Congratulations! Your new commission account can now have up to $37,950.00 a month
This is my Excerpt
LikeLike